Last night, I attended the first in a series of yearly events hosted by SUNY-Old Westbury. I found it through the Long Island Data Analytics Meetup Group and I’m really glad I went. After we got some pizza and hooked up to the WiFi, Professor Ashok Basawapatna took us through a great project on baseball pitches that he’s been working on.
The project involved processing data from pybaseball. I was surprised at the granular level of detail that the dataset had about every pitch thrown in an MLB game. Dr. Basawapatna mentioned that this attention to detail really surged in the wake of the success of the 2002 Oakland Athletics, AKA the “Moneyball” season. It seemed like you could reanimate the entire game given all the details in the data, but we concentrated on pitches.
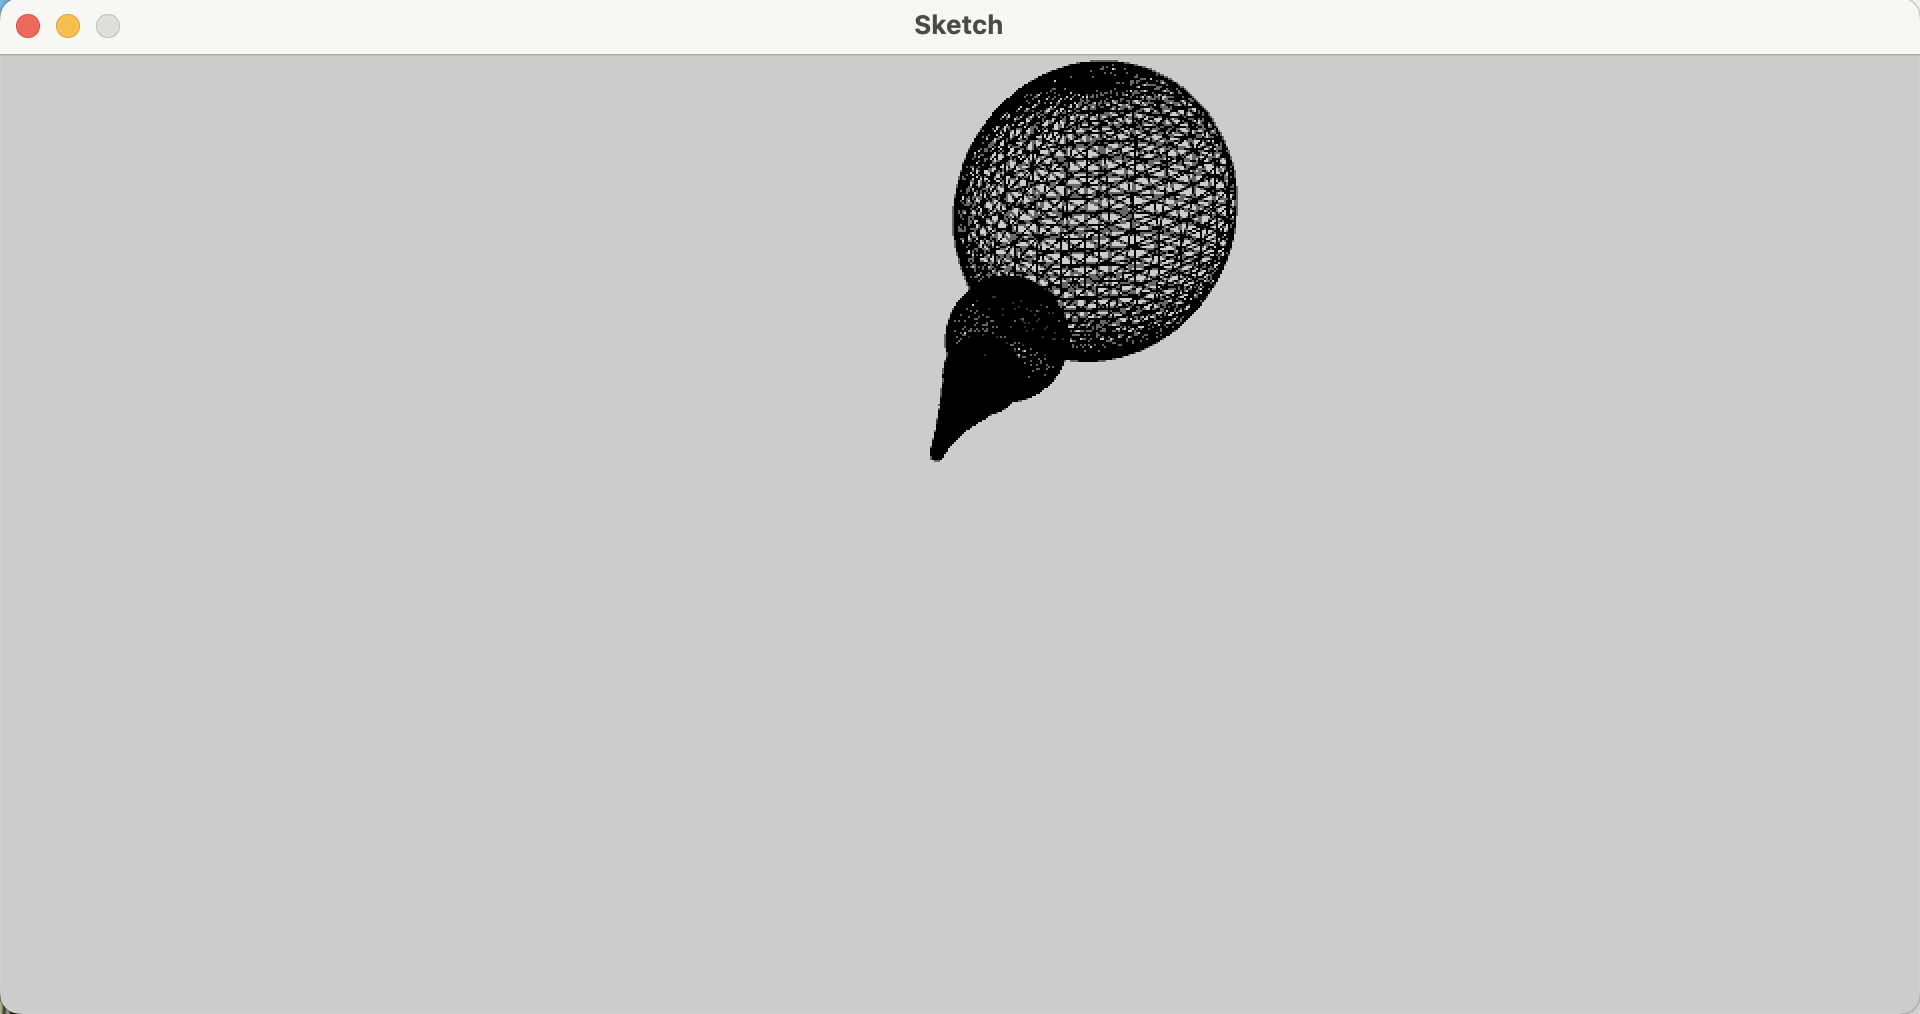
By taking information about the ball’s starting position and velocity in three dimensions, along with its average acceleration, we could approximate any pitch’s trajectory. While the dataset measures all these parameters with respect to home plate, we had to do some 3-D math in our heads in order to make these same details make sense graphically. But in the end, we got something! By the end of the hour and a half, we could take any pitch thrown in an MLB game and reconstruct what it would be like to be the catcher waiting behind home.

Not only was the presentation really cool, it was also great to see a big group of people together in a conference room getting excited about this stuff. We ended up having an impromptu meeting of people interested in reviving the PyData Long Island chapter too, so stay tuned on the Meetup page if you’re interested!